Fear & Greed Index
55
Greed
Market overheated — taking profit is reasonable.
Live price · refreshed every 30 seconds

Live SAND price, 24-hour trading history, conversion tables and the reporting behind what is moving the market right now.
SAND price now
$0.0585
Updated October 20, 2026 at 04:35 PM UTC · aggregated across exchanges
The Sandbox is trading at $0.0585 today. Over the past 24 hours the price is −1.38%: it opened at $0.0594, bottomed at $0.0565 and peaked at $0.0602.
The current SAND to USD rate is $0.0585. With 2,937,639,702 SAND in circulation, market cap is $171.9 M and 24-hour turnover is $59.9 M.
Buyers 50.0 %
Sellers 50.0 %
Indicators refresh hourly. Reference values, not trade signals.
55
Greed
Market overheated — taking profit is reasonable.
—
Bitcoin season
BTC dominance above 50% — the market is in bitcoin season
4.7%
Normal
Average daily range over the last 30 days
Top venues by 24-hour turnover. Altcoinlog is not affiliated with any of them.

Upbit
SAND/KRW
$0.0588

Binance
SAND/USDT
$0.0585

WhiteBIT
SAND/USDT
$0.0586

OKX
SAND/USDT
$0.0585

LBank
SAND/USDT
$0.0585

Coinbase Exchange
SAND/USD
$0.0587
The Sandbox is a community-driven platform where creators can monetize voxel ASSETS and gaming experiences on the blockchain. SAND is the utility token used throughout The Sandbox ecosystem as the basis of transactions and interactions. It is an ERC-20 utility token built on the Ethereum blockchain. There is a finite…
The Sandbox’s all-time high is $8.40, set on November 24, 2021. The current price is 99.30% below that peak.
All-time high
$8.40
ATH date
November 24, 2021
Days since ATH
1791
Below ATH
−99.30%
| Date | High | Low | Open | Close | Change |
|---|---|---|---|---|---|
| Oct 20, 2026 | $0.0599 | $0.0568 | $0.0568 | $0.0585 | +2.89% |
| Oct 20, 2026 | $0.0572 | $0.0565 | $0.0569 | $0.0568 | −0.01% |
| Oct 20, 2026 | $0.0584 | $0.0567 | $0.0583 | $0.0569 | −2.43% |
| Oct 20, 2026 | $0.0593 | $0.0574 | $0.0593 | $0.0583 | −1.65% |
| Oct 20, 2026 | $0.0602 | $0.0588 | $0.0588 | $0.0593 | +0.87% |
| Oct 19, 2026 | $0.0596 | $0.0583 | $0.0593 | $0.0588 | −0.84% |
| Oct 19, 2026 | $0.0605 | $0.0581 | $0.0581 | $0.0593 | +1.95% |
What a SAND purchase made years ago would be worth today. Calculated on the closing price of the selected month, fees excluded.
Value today
—
Total invested
$1,000.00
—
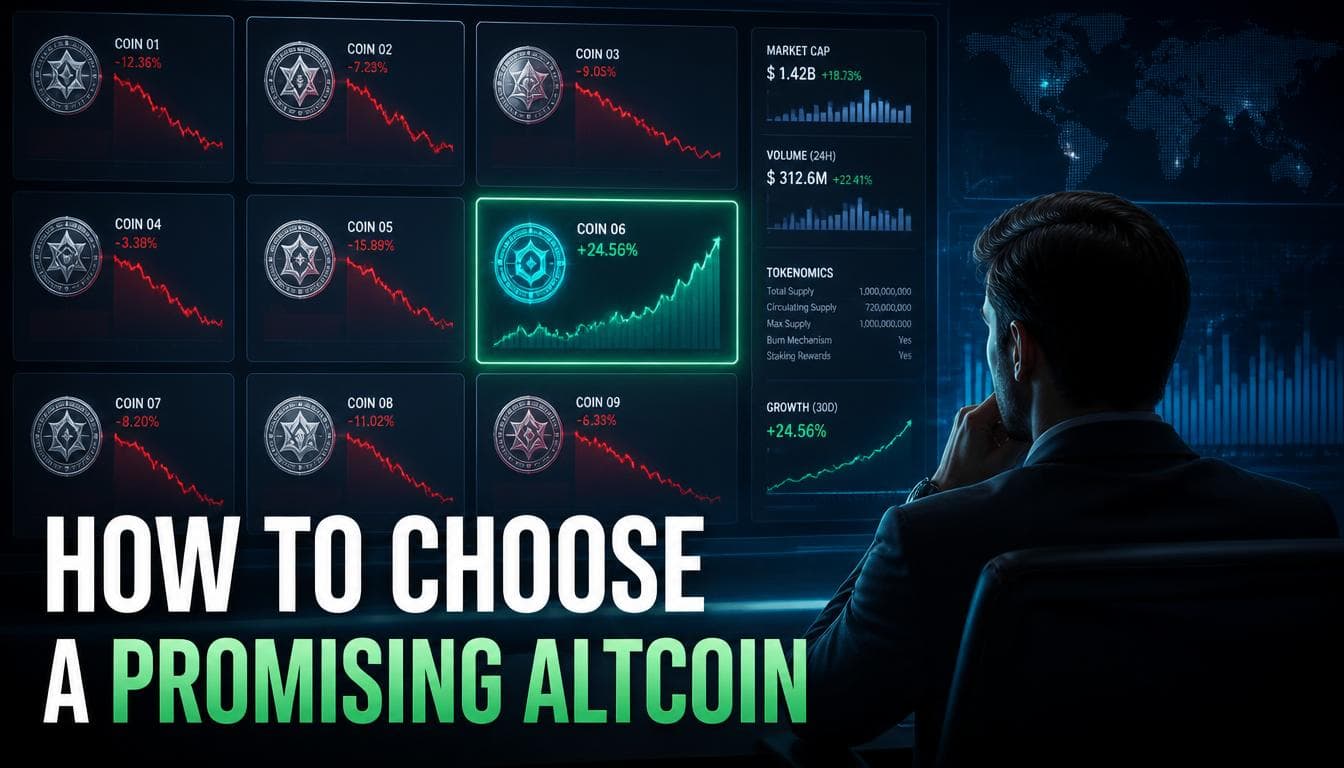 Crypto projects·64 days agoHow to Choose a Promising Altcoin: A Beginner's Guide
 Binance·64 days agoCrypto Security: How to Protect Your Coins
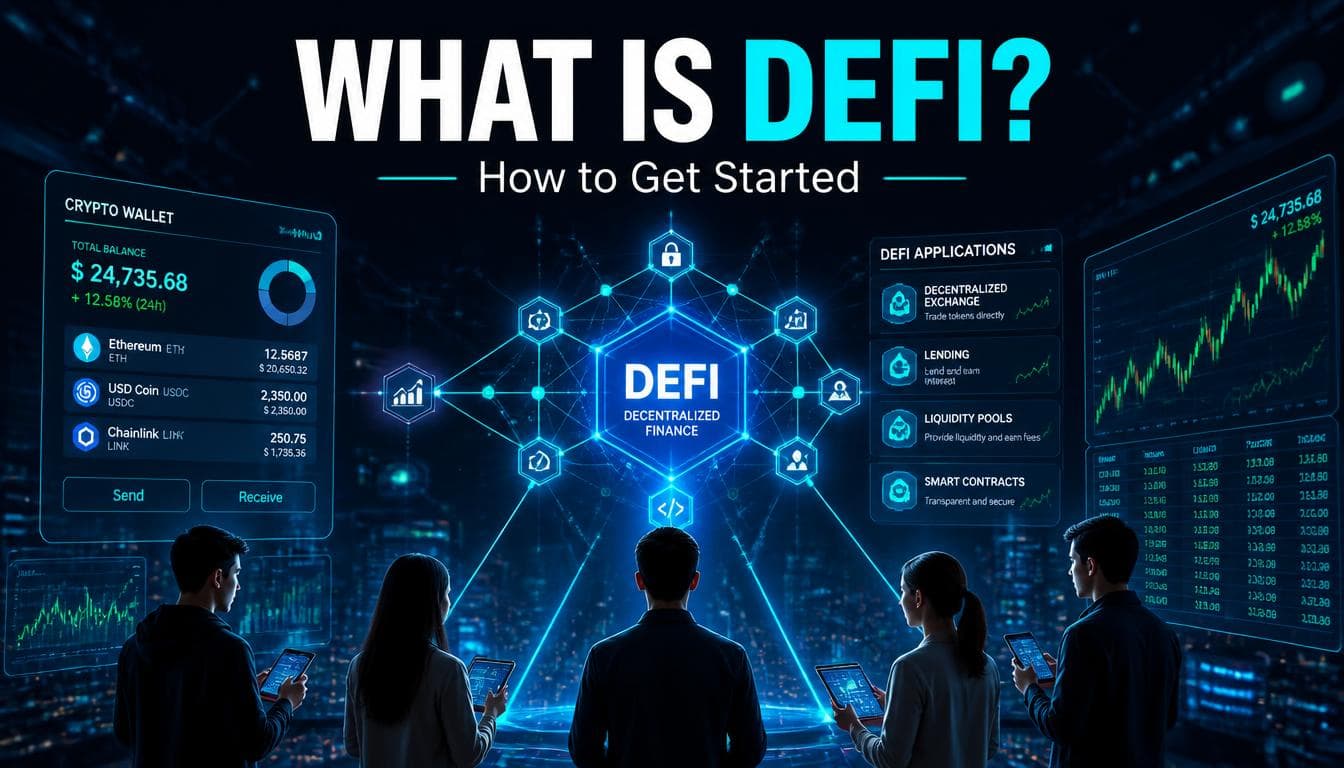 DeFi·67 days agoWhat Is DeFi and How to Get Started
SAND is trading at $0.0585. We show an aggregated CoinGecko price and refresh it every few minutes, so the number on this page can differ from a specific venue by a fraction of a percent.
Each venue has its own order book, volume and pair set. A fraction of a percent gap is normal. This page shows an aggregated quote, and the table lists individual exchange prices.
Short-term moves come from news flow, liquidity, macro data and market sentiment. The news and indicators below give context — they are not a trade signal.
It is the percentage difference between the current price and the session open. Low, high and open for the same window sit next to it.
No. The figures are for reference only and are not a recommendation to buy or sell. Check the quote on your chosen venue and consider the risks before trading.
Comments0
No comments yet. Be the first.
The information on this page is for reference only and is not individual investment advice, financial, legal or tax consultation, nor an offer or solicitation to buy, sell or hold digital assets.
Quotes, charts and market metrics come from public sources (aggregators and exchange APIs) and may differ from prices on a specific venue, lag or contain errors. Altcoinlog does not guarantee their accuracy or completeness and is not liable for decisions based on them.
Digital assets carry high risk: their value can fall to zero. Legal treatment varies by jurisdiction. You make trading decisions independently and at your own risk.
Mentioning exchanges, wallets or services does not imply endorsement or affiliation. Materials marked “Partner” or “Ad” are paid and labelled separately.
 SAND / USDT


